Analysis of usage of 48 data science tools by over 10,000 data professionals showed that data science tools could be grouped into a smaller set (specifically, 14 tool groupings). That is, some data science tools tend to be used together apart from other data science tools. Implications for vendors and data professionals are discussed.
Data professionals rely on data science tools, technologies and languages to help them get insights from data. A recent study showed that data professionals typically use around 4 data science tools. So, which data science tools they use? Are some tools used together? A previous study of data professionals showed logical tool groupings; that is, some tools tend to be used together, apart from other tools. I wanted to validate those previous findings using new survey data from Kaggle’s 2017 State of Data Science and Machine Learning study in which they collected responses from over 16,000 data professionals on a variety of data science practices, including their use of 48 different data science tools, technologies and languages.
Dimension Reduction through Principal Components Analysis
I used a data reduction approach called principal components analysis to help determine which tools tend to be used together. This approach groups the tools by looking at the relationship among all tools simultaneously. In general, principal components analysis examines the statistical relationships (e.g., covariances) among a large set of variables and tries to explain these correlations using a smaller number of variables (components).
The results of the principal components analysis are presented in tabular format called the principal component matrix. This matrix is an NxM table (N = number of original variables (in this case, data science tools) and M = number of underlying components). The elements of a principal component matrix represent the relationship between each of the data science tools and the underlying components. These elements represent the strength of relationship between the variables and each of the underlying components. By analyzing tool usage, the results of the principal components analysis will tell us two things:
- number of underlying components (tool groupings) that describe the initial set of data science tools
- which data science tools are best represented by each tool grouping
Results
This use of principal components analysis is exploratory in nature. That is, I didn’t impose a pre-defined structure on the data itself. The pattern of relationships among the 48 tools drove the pattern of results. While human judgment comes into play in the determination of the number of components that best describe the data, the selection of the number of components is based on the results. The goal of the current analysis was to explain the relationship among the 48 tools with as few components as was necessary. Toward that end, there are a couple of rules of thumb that I used to determine the number of components using the eigenvalues (output of principal components analysis). One rule of thumb is to set the number of components based on the number of eigenvalues greater than unity (1.0). Another way is to plot (called a scree plot) the 48 eigenvalues to identify a clear breaking point along the eigenvalues.

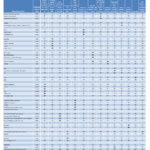
Table 1. Principal Component Matrix of 48 Data Science Tools, Technologies and Languages – data from Kaggle 2017 The State of Data Science and Machine Learning survey of data professionals. Click image to enlarge.
The plot of the eigenvalues appeared to break around the 13th and 14th eigenvalue. Also, there were 14 eigenvalues greater than unity. Therefore, I chose a 14-factor solution to explain the relationships among the 48 data science tools.
Based on a 14-factor solution, the principal component matrix (see Table 1) was somewhat easy to interpret. Some of the cell values in the matrix in Table 1 are bold to represent values greater than .32. The components’ headings are based on the tools that loaded highest on that component. For example, three IBM products loaded highly on component 8, showing that usage of these tools by a given respondent tend to go together (if you use one of IBM’s tools, you tend to use the other(s)); as a result, I labeled that component as IBM. Similarly, based on the tools that were highly related to the other 13 components, the other 13 components were labeled accordingly.
Tool Groupings
The results suggest that 14 tool grouping describe the data well. I’ve listed the 14 groupings below by including the tools that describe each grouping. Tools that fall within a specific group tend to be used together.
- Python, Jupyter notebook, TensorFlow, SQL, Unix shell / awk, R
- Cloudera, Impala, Hadoop / Hive / Pig, Flume, Spark / MLlib
- MS R Server, MS SQL Server DM, MS Azure, MS Excel DM
- SAS Base, SAS Enterprise Miner
- KNIME (free, commercial), RapidMiner (free, commercial), Orange
- MATLAB / Octave, C/C++, Mathematica
- IBM SPSS Modeler, IBM Watson, IBM Cognos
- Amazon ML, Google Cloud Compute, Amazon Web Services
- Minitab, IBM SPSS Statistics
- Perl, Java, Oracle Data Mining / Oracle R Enterprise
- Salfrod Systems, Angoss
- TIBCO Spotfire, QlikView
- Stan, Julia
- SAP Business-Objects Predictive Analytics, SAS JMP
There were four data science tools that did not clearly load on a single component; these tools include DataRobot, NoSQL, Statistica (Quest/Dell, formerly Statsoft) and Tableau. It appears these four data science tools are not typically associated with any single data science tool. For example, NoSQL use is moderately related to the use of Python (component 1), Cloudera (component 3) and Perl (component 11). Also, the use of Tableau is related to the use of Minitab (component 9) and TIBCO Spotfire (component 12).
Conclusions
The use of specific data science tools, technologies and languages tend to occur together. Based on the current analysis of tool usage, the 48 tools can be grouped into a smaller subsets of tools. The results of the current analysis are somewhat consistent with the prior results. I generally found product grouping based brands (e.g., Amazon, IBM, SAS, Microsoft) such that data professionals who use a specific tool from a brand likely use other tools from that same brand.
Some of the findings around specific brands were counter-intuitive. For example, the use of IBM SPSS Statistics was more closely associated with Minitab than with other IBM products. Also, SAS JMP was more closely linked to SAP Business Objects than with other SAS products. In a prior analysis of tool usage, however, I found that all IBM products and all SAS products were associated with their respective unique component.
In the current analysis, I found that the use of Python is closely associated with the use Jupyter notebooks. While the use of R is associated with Python and Jupyter adoption, it’s a relatively weak association; in fact, R is also associated with other data science tools like MS and SAS tools. Not surprisingly, I found that many open source tools like Hadoop, Spark/MLlib, Impala and Flume were associated with the use of Cloudera.
For data science tool vendors (e.g., IBM, SAS, Microsoft, Amazon), the results are clear: while cross-selling your own data science tools to existing customers appears to an easy way to improve revenue, attracting new customers appears more difficult; after all, data professionals who already use open-source data science tools (e.g., Python) tend to use other open-source tools. It would be interesting to see if there are differences between data professionals who use open-source tools vs those who do not. Perhaps data professionals who use open-source tools are younger, work for smaller companies (startups on a limited budget). I’ll explore the data more to see if there are any underlying differences between types of data professionals.
For data professionals, to improve your chances of success in your data science projects, it’s important that you select the right data tools. No single tool will do it all and you will likely need to use a set of tools in your data projects. One way to help in your tool selection process is to identify the tools sets that other data professionals tend to use together. The current results suggest that you might want to consider tools within components as potential candidates to include in your arsenal.


 Beyond the Ultimate Question
 Measuring Customer Satisfaction and Loyalty (3rd Ed.)
Comments are closed.