Top of Page

Author Archive | Bob Hayes

Figure 2.

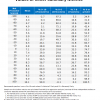
Estimating Other “Likelihood to Recommend” Metrics from Your Net Promoter Score (NPS)

In the realm of customer experience management, businesses can employ different summary metrics of customer feedback ratings. That is, the same set of data can be summarized in different ways. Popular summary metrics include mean scores, net scores and customer segment percentages. Prior analysis of different likelihood to recommend metrics reveal, however, that they are highly […]
Continue Reading
Check out Business Over Broadway

Top 10 BOB Blog Posts of 2013: It’s all About Loyalty and Analytics

I’ve rounded up my most popular (based on pageviews) blog posts from 2013. The top blog post was on the Customer Loyalty Measurement Framework which received three times as many views as the second most popular blog post. Many of the remaining top blog posts were on how companies can improve the value of their […]

Continue Reading
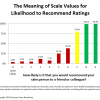
Figure 1. Meaning of Scale Values for Likelihood to Recommend Ratings

The Meaning of Scale Values for Likelihood to Recommend Ratings

Customer experience management professionals use self-reported “likelihood” questions to measure customer loyalty. In their basic form, customer loyalty questions ask customers to rate their likelihood of engaging in different types of loyalty behaviors toward the company, including behaviors around retention (likelihood to leave), advocacy (likelihood to recommend) and purchasing (likelihood to buy different products). These loyalty […]

Continue Reading
Click image to enlarge.

Two More Customer Experience Facts and Suggestions You Can’t Ignore [INFOGRAPHIC]

Keepify rounded up some facts about the customer experience (CX) and presented them in an infographic titled “14 Customer Experience Facts Marketers Can’t Ignore.”  These facts illustrate how companies are getting value from their CX data. I took away two things from these 14 facts: two more facts. For me, these two new facts help […]

Continue Reading
Confirmation Bias

In Data We Trust

The use of data in driving business decisions is a competitive imperative in today’s business world, improving how companies market to, sell to, and service their customers. Yet IBM found that 1 in 3 business leaders do not trust the information they use to make decisions. When business leaders don’t believe their data, they likely are not going to […]

Continue Reading
2013 infographic.six points

Six Practices Critical to Creating Value from Data and Analytics [INFOGRAPHIC]

IBM Institute for Business Value surveyed 900 IT and business executives from 70 countries from June through August 2013. The 50+ survey questions were designed to help translate concepts relating to generating value from analytics into actions. They found that business leaders adopt specific strategies to create value from data and analytics. Leaders: are 166% more likely […]

Continue Reading
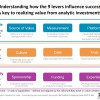
Figure 1. Nine Levers to Value Creation from Analytics

Creating Value from Analytics: The Nine Levers of Business Success

IBM just released the results of a global study on how businesses can get the most value from Big Data and analytics. They found nine areas that are critical to creating value from analytics. You can download the entire study here. IBM Institute for Business Value surveyed 900 IT and business executives from 70 countries […]

Continue Reading

bob@businessoverbroadway.com | 206.372.5990

UA-23043697-1