Business leaders understand the advantage of using the power of artificial intelligence and machine learning to stay ahead of their competitors. However, understanding the power of AI is a lot different than actually successfully implementing it in companies. For example, in 2017, Gartner estimated that Big Data projects have a success rate of only 15%. While organizational factors may be a primary reason for this poor success rate, another reason for such a high failure rate could be due to a lack of AI / Machine Learning talent needed to successfully pursue these types of projects. Specifically, it’s been shown that there is a lack of advanced machine learning talent among data professionals; less than 20% of surveyed data professionals said they were competent in such areas as Natural Language Processing (19%), Recommendation Engines (14%), Reinforcement Learning (6%), Adversarial Learning (4%) and Neural Networks – RNNs (15%).
So, how do companies leverage the power of AI with these skills gaps? IBM is using the power of its Watson Studio platform to extend the power of AI to many more people who fall outside of AI expert coders. IBM Watson Studio is an end-to-end analytics and AI solution to help you gain insights from your data. Watson Studio accomplished this feat by providing the option to build custom models or leverage pre-trained models.
In this article, I will briefly review several capabilities of Watson Studio and compare two machine learning models that predict customer churn of mobile users.
To understand how IBM is helping businesses leverage the power of AI, let’s look at the steps of machine learning. As you can see from the figure below, the machine learning workflow contains many steps.
- Acquire Data
- Explore Data
- Prepare Data
- Create Features/Predictors (Feature Engineering)
- Select Model
- Train Model
- Tune Hyperparameters
- Make Predictions
For this article, I will cover steps 1 through 6 to see how Watson Studio can help you improve your machine learning capabilities by simplifying your data workflow.
IBM Watson Studio
IBM Watson Studio was designed to help accelerate machine learning workflows. This solution provides diverse data professionals a wide variety of tools to help them work more effectively together. Whether you are a data scientist, machine learning engineer, application developer or subject matter expert, Watson Studio should be able to help you work with your peers to help you build, train, evaluate and deploy machine learning models efficiently and at scale. If you’re like me, my strength lies in quantitative methods; that means, I don’t code. My hope is that Watson Studio can help me augment my quantitative skills with the power of machine learning capabilities.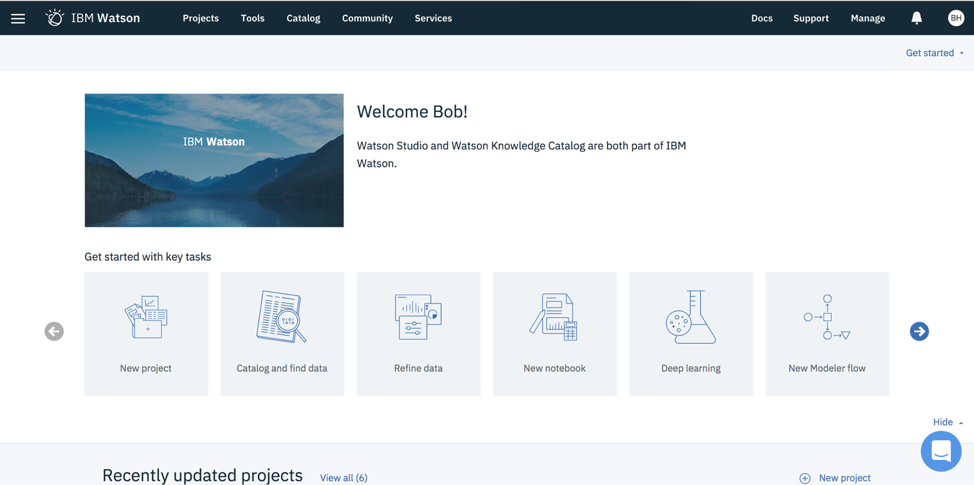
After logging into the Watson Studio platform, you are presented with several options for your specific analytics needs, from starting a new project and finding data to conducting deep learning work and developing a model via a visual interface. The options include:
- New project: Organize resources (like data assets, collaborators, notebooks) to achieve your analytics goals.
- Catalog and find data: Discover, index and share data
- Refine data: Cleanse and shape your data to prepare it for analysis.
- New notebook: Create a Jupyter notebook to run code that processes your data, then view the results inline.
- Deep learning: Learn about deep learning capabilities
- New modeler flow: Connect nodes to build a Modeler flow to explore your data and train machine learning models.
- New model: Build and train a model for your data in a guided machine learning pipeline.
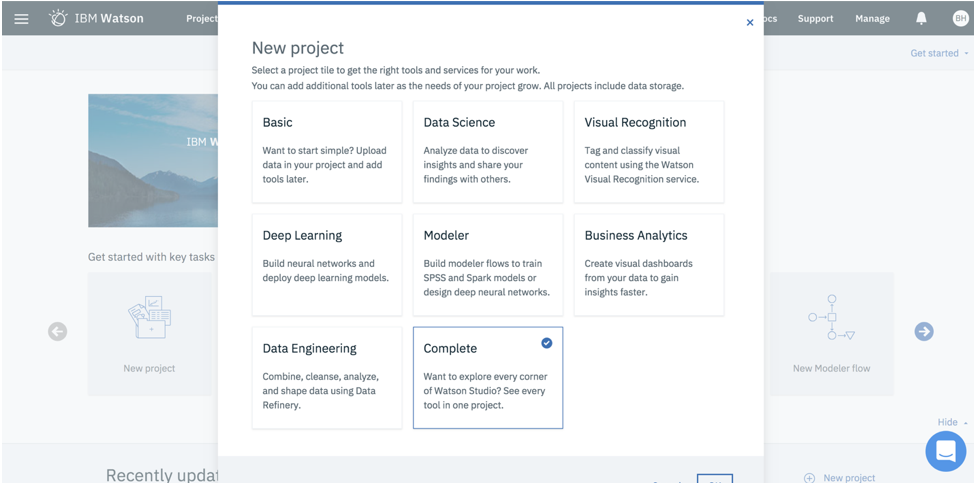
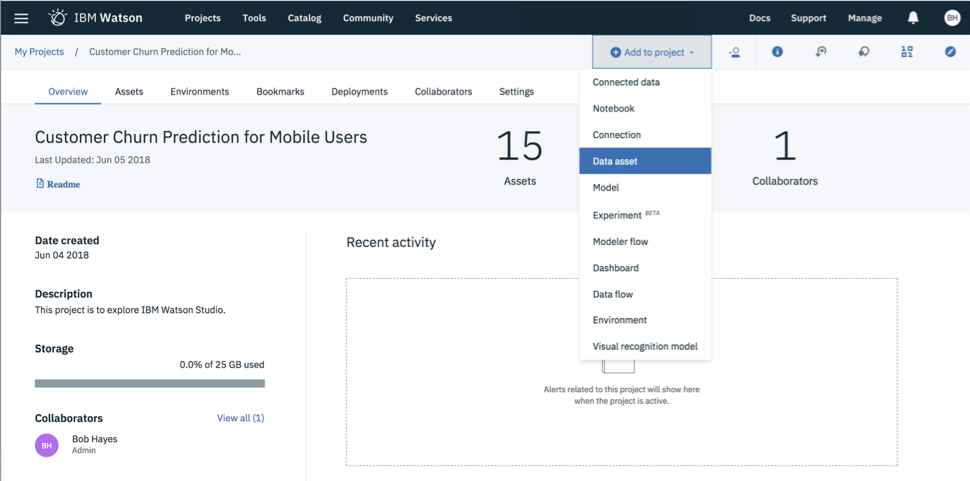
Next I will create a New Project in which I will apply machine learning capabilities to help me predict customer churn.
1. Acquire Data
The first step is to acquire and load the data into Watson Studio. I found a free data source from Kaggle regarding the churn status of mobile users. Additionally, the data set included other information about the user, including type of plan, number of minutes on the phone and location.
I uploaded this data set via a csv file.
2. Explore Data
After you have connected your data set to Watson Studio, the next step is to explore the data set to better understand the variables with which we are working. Watson Studio has a Dashboards feature that will help you accomplish this task.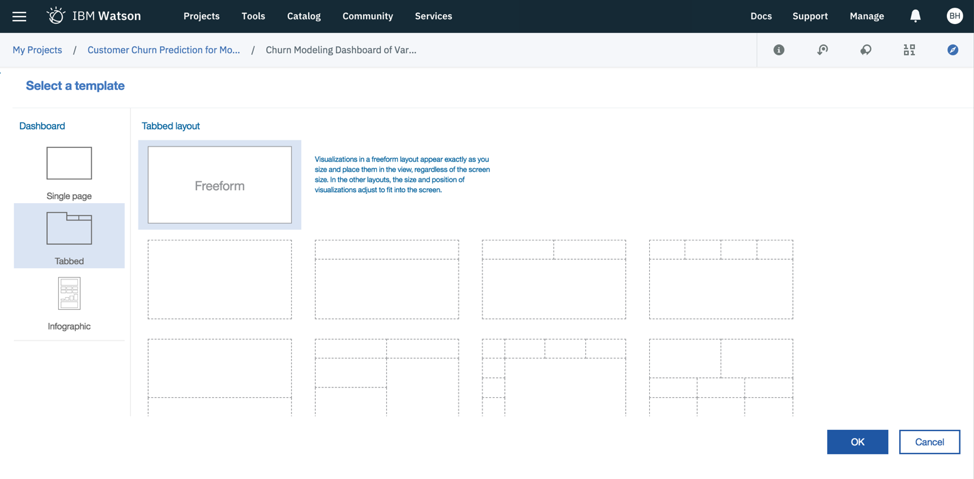
The dashboard includes three broad templates, including a single page, a tabbed page and an infographic. I have selected the tabbed template (free form) for this example.
First, connect your data source to the dashboard (data asset).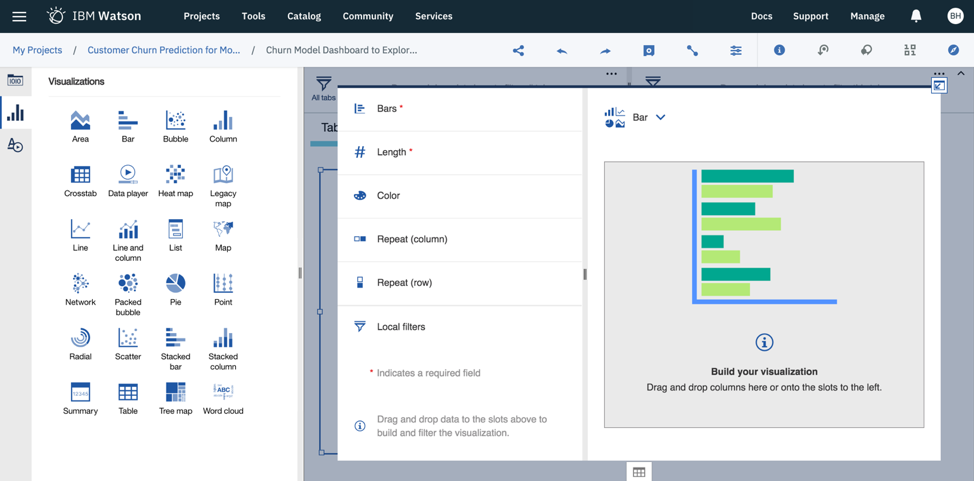
As you can see, there are many different chart options to visualize your data. Chart types include bar (column) graphs, pie charts, maps, I’ll take a look at a few of the variables in our data set. I will first take a look at the length of accounts.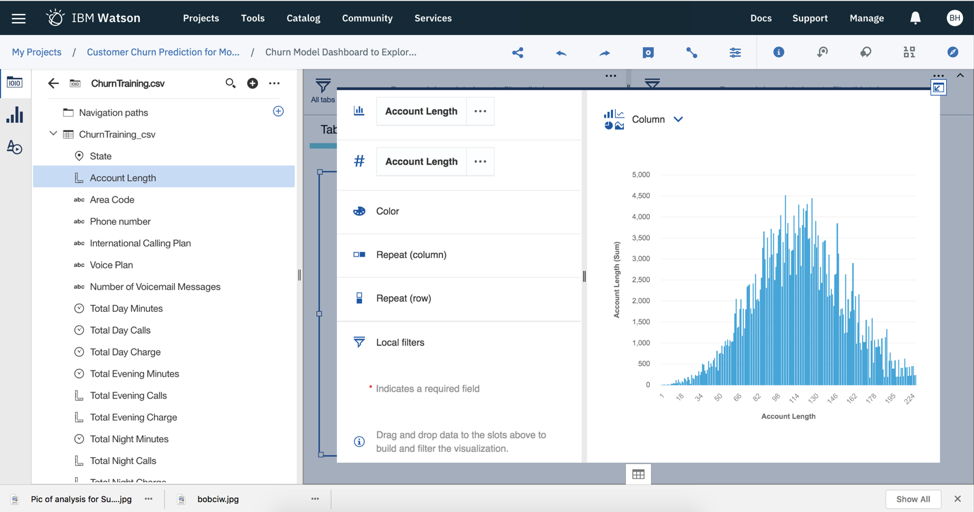
Account length forms a nice normal distribution. I’ve explored other variables like the number of responses per state, the number of customer service calls, the number of evening calls and churn status. You can even add a filter to explore subsets of your data (say, by state, for this example).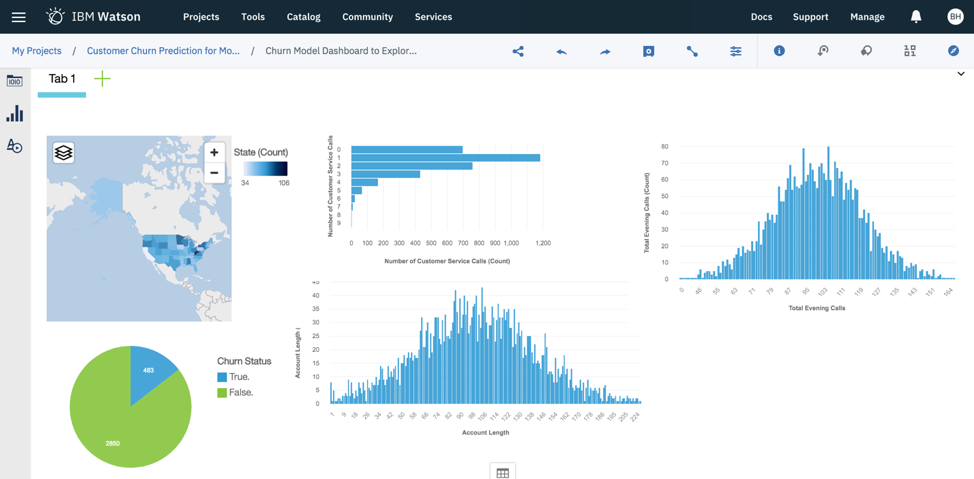
Next, I will take a more in-depth look at the variables using a more sophisticated approach (rather than the interocular test – “eye-balling” the data).
3. Preparing your Data
A Jupyter notebook is an environment for interactive computing. With just a few clicks of the mouse, you are able to run code to process your data and subsequently see the results of the computation. Notebooks include the pieces you will need to process your data. These pieces include:
- The data
- The code computations that process the data
- Visualizations of the results
- Text and rich media to enhance understanding
With IBM Watson Studio, you can create Python, Scala, and R notebooks to analyze your data. In the image below, you can see both the code that was generated to upload the data. After running the code, you will see your data in the window below it.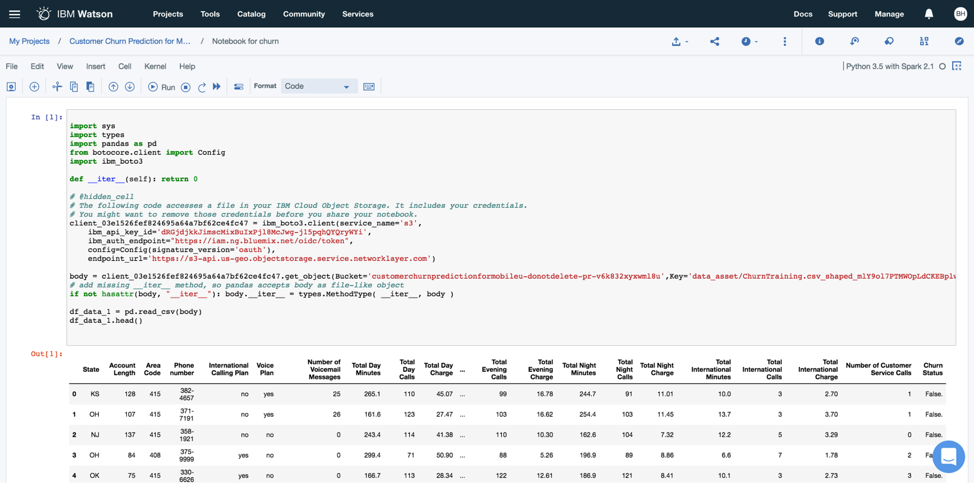
I got code from a colleague to run some basic statistics on the variables in the data set. The results revealed that there are 3333 records (customers) in this data set. Additionally, we can see the descriptive statistics for some of the variables (e.g., mean, min, max).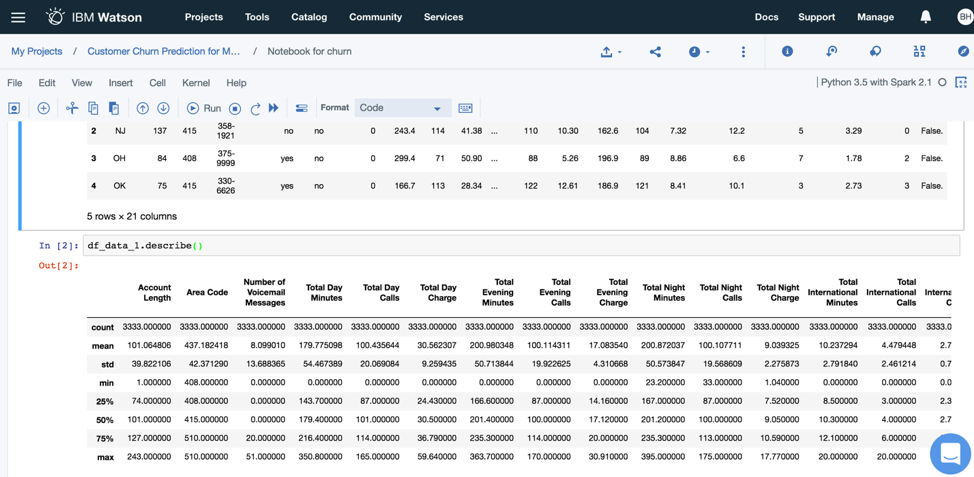
If you’re like me and you don’t code, you can also see some basic information about the variables in your dataset using the Data Refinery option.
Data Refinery
Select the “Data Refinery” option from the Tools dropdown menu and select the data set you would like to refine.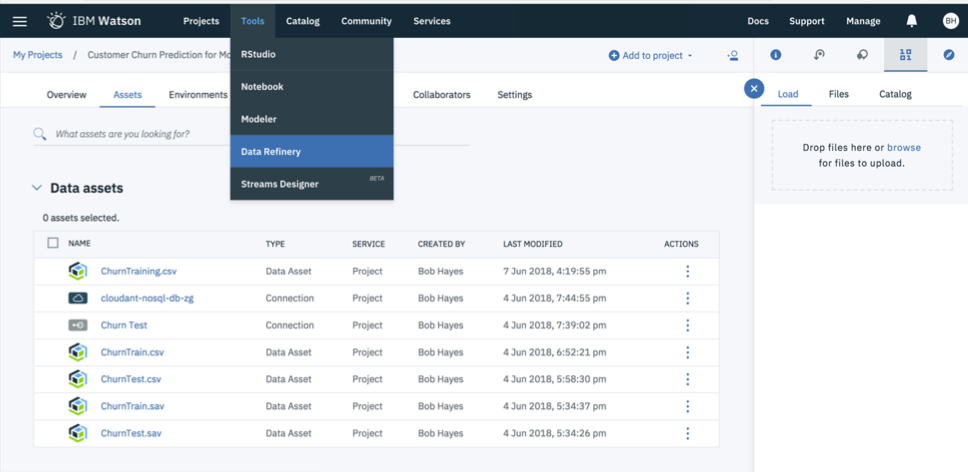
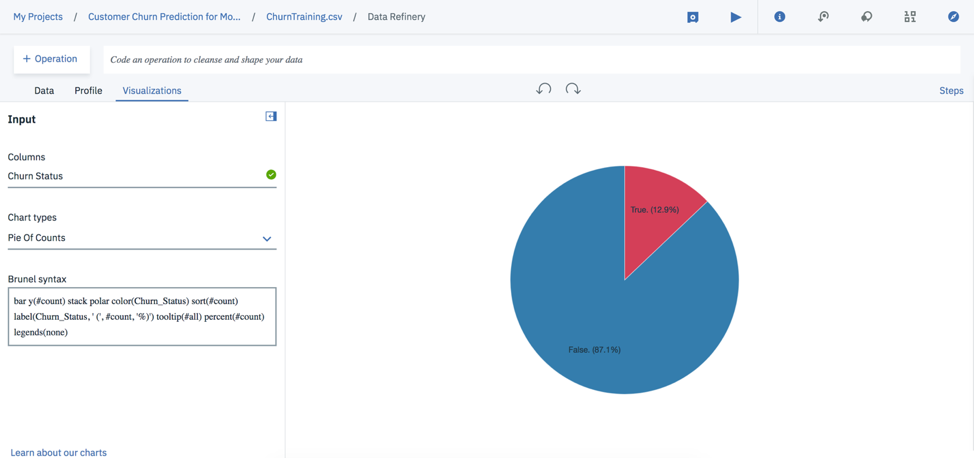
Below is the visualization of my data set.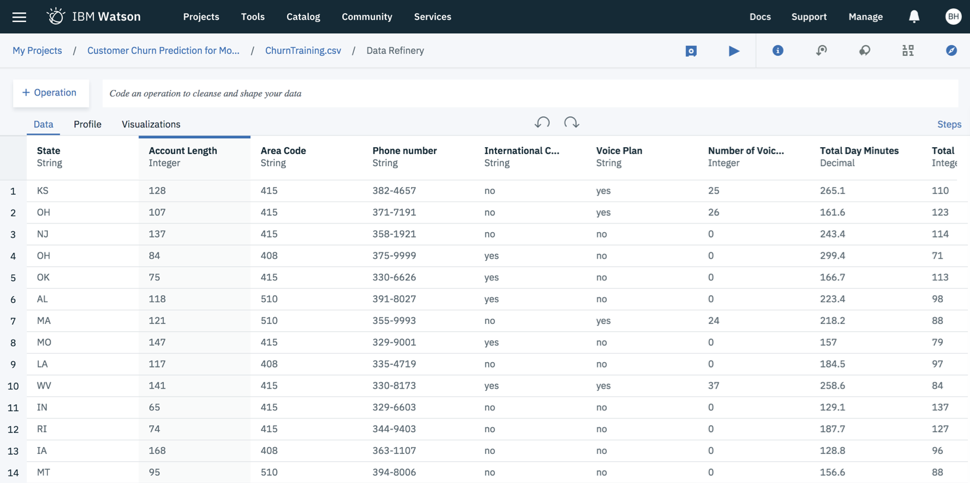
Once in the Data Refinery option, you can select the Profile and Visualization tabs to get a nice visualization of the variables in your data set along with some basic statistics for each variable. Rather than writing code, I prefer this “clicking” method of getting a sense of the shape and quality of the data.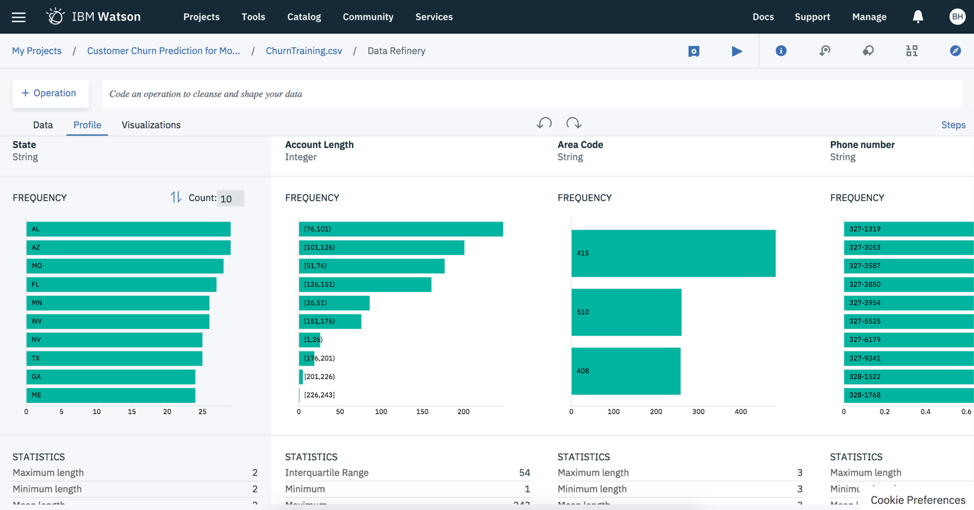
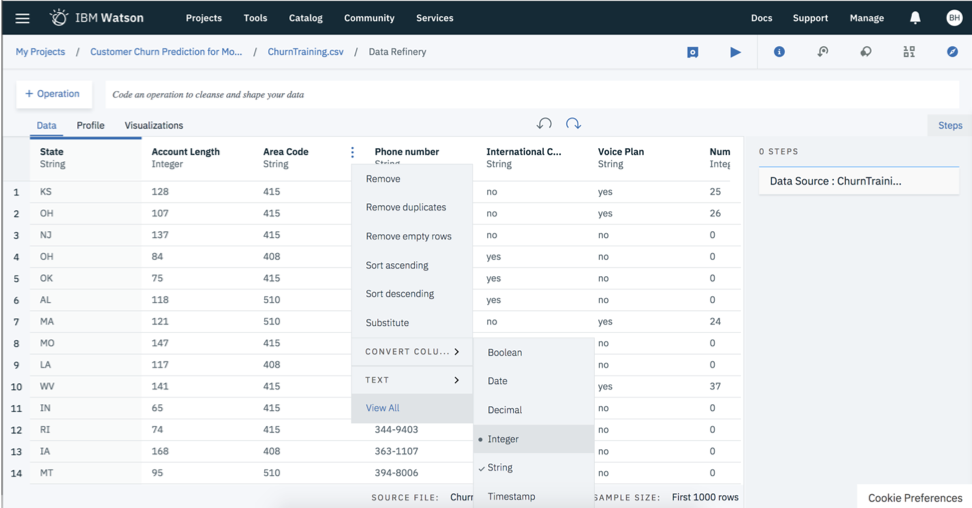
To prepare your data, return to the Data tab of the “Data Refinery” option and click on a variable that you would like to modify and hit the “+ Operation” tab (or simply hit the three buttons next to the variable name). You will have a plethora of options to cleanse and organize your data, including:
- Renaming variables
- Removing duplicates
- Removing empty rows
- Converting variables to specific types (e.g., integers, dates and decimals)
- Sorting
- Concatenating
- Create a new variable/feature (based on current variables)
After you have prepared your data, the next step is to run the data flow on the data set. This step will change all the variables that you specified. You can run the data flow now or schedule it for a later time. The resulting new dataset will be saved in your data assets.
4. Feature Engineering
Using the Data Refinery option, you will be able to create new variables (or features) to use as predictors of your outcome variable of interest (in this case, customer churn). Domain expertise is required for this step. Understanding the content domain can help you create commonly used variables/features that are known to predict customer churn. For the curious souls, you can also use your imagination to think of possible features that could contribute to the prediction of your outcome.
5 and 6. Select and Train your Model
Building your machine learning model in Watson Studio is pretty easy. The two-step process of building your model includes selecting your model and training your model. The first step is to add a Model to your project. You have two options to developing your model: 1) automatic and 2) manual. I will try the automatic modeling first.
Automatic Modeling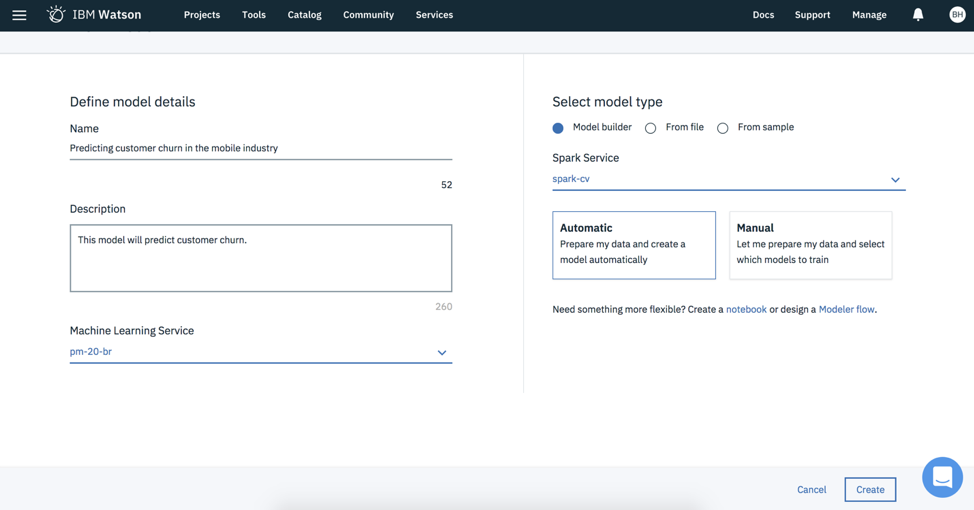
After you hit the “Create” button, you will be asked to select the data set of interest on which you want to build the model.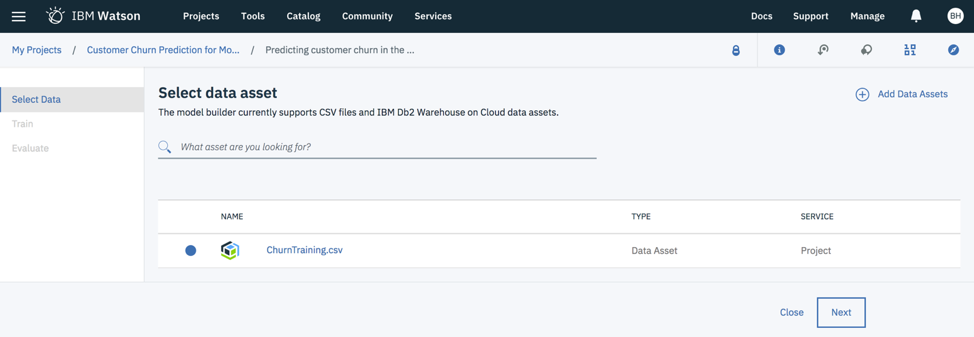
For the Customer Status variable that I want to predict, it’s important to know that this variable has two values; a value of “True” indicates the customer churned. A value of “False” indicates the customer did not churn. So, an appropriate modeling technique is binary classification. In fact, Watson Studio even suggested this technique to use for the analysis. For the “Feature columns,” you have the option of selecting all variables or a subset of variables. I selected all variables except for telephone number.
To validate the model, you need to separate your variables into a training, testing and holdout sample. I kept the default values presented by Watson Studio.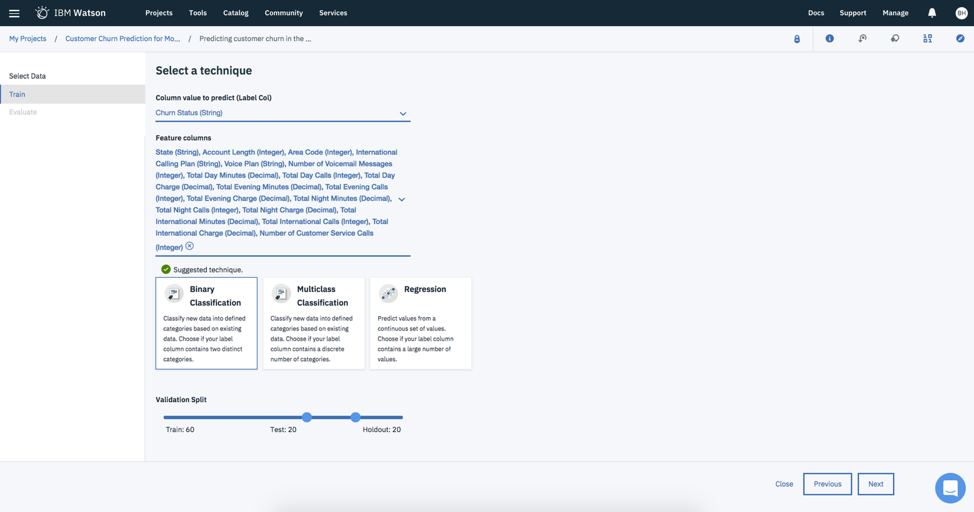
After hitting the Next button, Watson Studio will train the model and evaluate how well the model performs. As you can see, Watson Studio selected the Logistic Regression technique to predict Churn Status. The resulting model was defined as “Fair” with a reported ROC figure of .79 and PR figure of .48. You can save this model if you would like to use it later to run on new data.
Manual Modeling
Next, I will use the Manual modeling approach so that I can select the modeling technique. Once you have selected the Manual modeling approach, you will be asked to select the outcome you want to predict (Column value to predict) and the features (Feature columns) to predict that outcome. I selected the same features as before.
You will also need to select the estimators (see upper right).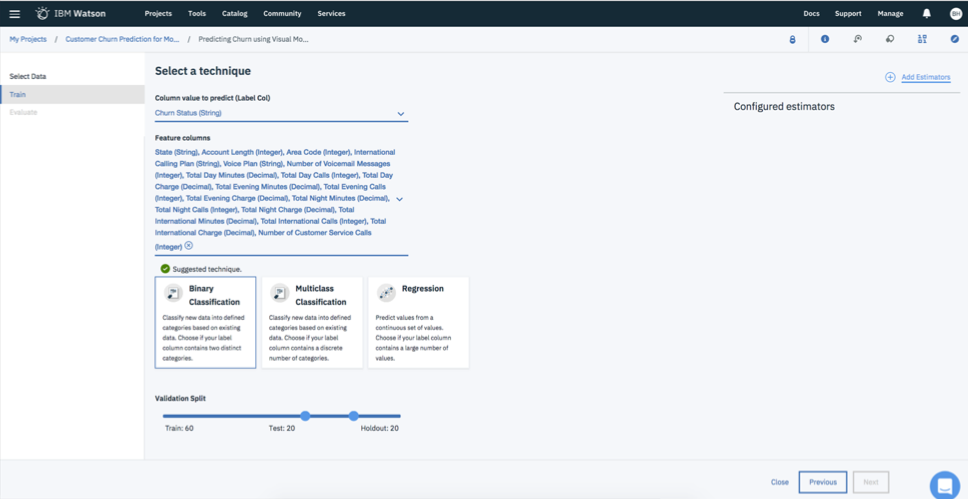
For this example, Watson Studio offers up four different estimators:
- Logistic Regression
- Decision Tree Classifier
- Random Forest Classifier
- Gradient Boosted Tree Classifier
I opted for Random Forest Classifier. After hitting the Next button, Watson Studio will train the model and evaluate how well the model performs.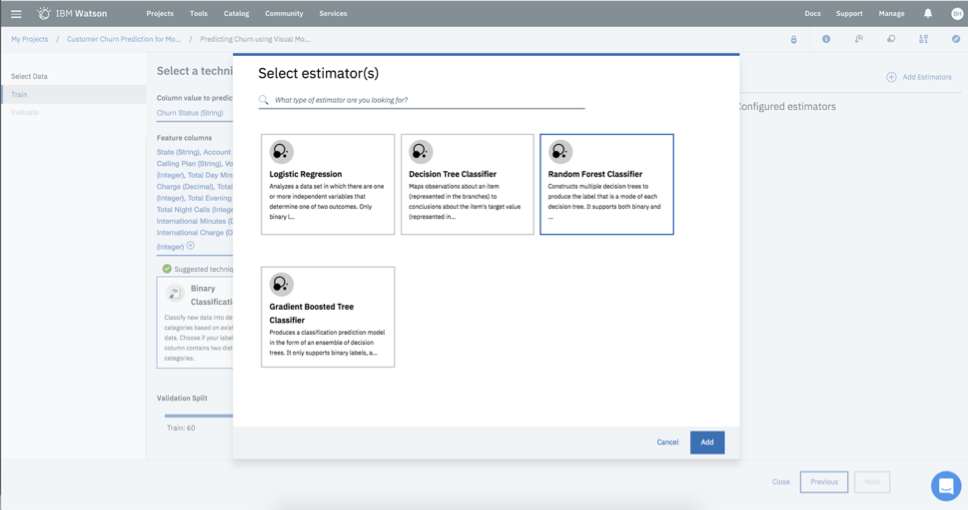
The resulting model was defined as “Excellent” with a reported ROC figure of .92 and PR figure of .84. Again, you can save this model if you would like to use it later to run on new data.
Summary
This article represents my first attempt at using Watson Studio. While I have taken many courses in statistics and quantitative methods, the only coding class I took was Fortran (and that was for a foreign language requirement in graduate school!). While I have always been envious of data professionals who can code (I’m looking at all my engineering friends), I feel less envious after using Watson Studio. My hope is that all data science applications will be easy to use.
Watson Studio was fairly easy to use. Their great online resource to learn about the capabilities of Watson Studio as well as their FAQ page helped me quickly gain confidence in using the platform. Whether you are a clicker or coder, you will find that Watson Studio will fit into your skillset. Coders will be able to code, and clickers will be able to use tools to help automate many of the machine learning steps, including building dashboards, selecting modeling techniques and automatically preparing your data for analysis. I’m looking forward to continue learning this platform in the months to come.
This post was brought to you by IBM Watson Studio. I received compensation to write this post but all opinions expressed are my own.




 Beyond the Ultimate Question
 Measuring Customer Satisfaction and Loyalty (3rd Ed.)
Comments are closed.