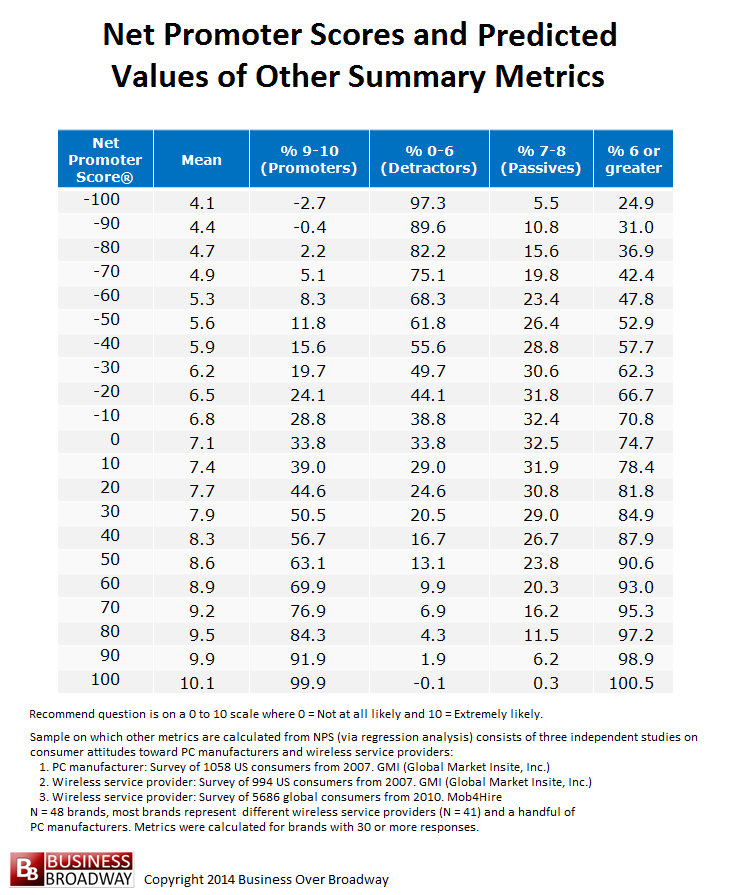
The Net Promoter Score (NPS), a metric used to gauge the health of the customer relationship, has been used by companies for years. By applying data science principles to understanding the research behind the NPS, however, we see that the NPS claims have three serious problems. First, the “research” behind the NPS claims is flawed. Second, the calculation of the metric (a difference score) results in an ambiguous score that is difficult to interpret. Third, the NPS is insufficient in measuring the multidimensional nature of customer loyalty. Research using data science principles shows that 1) other loyalty questions (e.g., “satisfaction,” “buy again”) are just as good as the “recommend” question in predicting growth, 2) mean scores or top box scores are better than net scores in summarizing data and 3) you need to ask about other types of customer loyalty (e.g., retention, expand usage) that extend beyond just recommendations.
NPS Background
In 2003, the Net Promoter Score (NPS) was formally introduced by Fred Reichheld, and, today, it is used by many of today’s top businesses to monitor and manage customer relationships. Fred Reichheld and his co-developers of the NPS say that a single survey question, “How likely are you to recommend Company Name to a friend or colleague?”, is the only loyalty metric companies need to grow their company.
NPS Methodology
The NPS is calculated from a single loyalty question, “How likely are you to recommend us to your friends/colleagues?” Based on their rating of this question using a 0 (Not at all likely) to 10 (Extremely likely) scale, customers are segmented into three groups: 1) Detractors (ratings of 0-6), 2) Passives (ratings of 7-8) and 3) Promoters (ratings of 9-10). A company can calculate its Net Promoter Score by simply subtracting the proportion of Detractors from the proportion of Promoters:
NPS = prop(Promoters) – prop(Detractors)
NPS Claims
Fred Reichheld, the co-developer of the NPS (along with Satmetrix and Bain & Company) has made very strong claims about the advantage of the NPS over other commonly used loyalty metrics. Specifically, they have said:
- The NPS is “the best predictor of growth,” (Reichheld, 2003)
- The NPS is “the single most reliable indicator of a company’s ability to grow” (Netpromoter.com, 2007)
- “Satisfaction lacks a consistently demonstrable connection to… growth” (Reichheld, 2003)
Reichheld supports these claims with research displaying the relationship of NPS to revenue growth. In a compelling graph, Reichheld (2006) illustrates that companies with higher Net Promoter Scores show better revenue growth compared to companies with lower Net Promoter Scores. However, Reichheld sites only one study conducted by Bain & Associates (co-developers of the NPS) showing the relationship between satisfaction and growth to be 0.00. [1]
NPS Problem #1: NPS is not the best predictor of growth
Independent researchers have conducted rigorous scientific research regarding the NPS and found that the original NPS claims are not substantiated. For example, Keiningham et al. (2007), using the same technique employed by Reichheld to show the relationship between NPS and growth, used survey results from the American Customer Satisfaction Index (ACSI) to create scatterplots to show the relationship between satisfaction and growth. Looking at the personal computer industry, they found that satisfaction is just as good as the NPS at predicting growth. Keiningham et al. (2007) found the same pattern of results in other industries (e.g., insurance, airline, ISP). In all cases, satisfaction and NPS were comparable in predicting growth.
Still, other researchers (Morgan & Rego, 2006) have shown that other conventional loyalty measures (e.g., overall satisfaction, likelihood to repurchase) are comparable to the NPS in predicting business performance measures like market share and cash flow. Contrary to Reichheld, other researchers, in fact, have found that customer satisfaction is consistently correlated with growth (Anderson, et al., 2004; Fornell, et al., 2006; Gruca & Rego, 2005).
Bottom line: NPS (i.e., recommend question) is not the best predictor of growth. The satisfaction question is just as good at predicting growth.
NPS Problem #2: Difference (Net) scores are unnecessary
Customer metrics are numerical scores or indices that summarize customer feedback results. The NPS metric is a difference score (% of Promoters – % of Detractors). But there are other, better approaches to summarizing data, including:
- Mean Scores: This is the arithmetic average of the set of responses. The mean is calculated by summing all responses and dividing by the number of responses. Possible scores can range from 0 to 10.
- Top Box Scores: The top box score represents the percentage of respondents who gave the best responses (either a 9 and 10 on a 0-10 scale). Possible percentage scores can range from 0 to 100.
- Bottom Box Scores: The bottom box score represents the percentage of respondents who gave the worst responses (0 through 6 on a 0-10 scale). Possible percentage scores can range from 0 to 100.
Why the NPS camp uses a difference score as their summary metric is beyond me. It makes absolutely no sense. If you wanted to summarize the typical height of a group of people, would you calculate a summary metric that subtracts the % of people under 5’ from the percent of people over 6’ to get a “Net Height Score?” No. That’s ridiculous. Instead, you would calculate the average height (or median) as your summary metric.
And for those of you who believe that the NPS tells you something different than the mean score, you’re wrong. In a prior study, I compared the Net Promoter Score and the Mean Recommend Score across 48 companies. I found that the correlation between the Mean Score and the NPS across the 48 brands was .97! That is, the NPS does not provide any additional insight beyond what we know from the Mean Score; both metrics are telling us essentially the same thing about how the brands are ranked relative to each other.
Additionally, because the NPS is a difference score, it lacks meaningful scale of measurement. While the original ratings of the recommend question can vary from 0 to 10, the NPS values can range from a low of -100 to a high of 100. So, what does an NPS of zero (0) indicate? Given that zero (0) falls exactly between the two ends of the NPS continuum, you would think that a zero value would indicate half of the respondents would recommend and the other half would not. But that is not the case (see Figure 1). An NPS score of 0.0 equates roughly to a Mean Score of 7.1.
Bottom line: The NPS (a difference score) obfuscates the true underlying meaning of the customer responses. Don’t use difference scores to summarize your survey data. Instead, stick with simple summary metrics like mean or top/bottom box scores.
NPS Problem #3: NPS represents only one dimension of customer loyalty

Figure 2. The RAPID Loyalty indices (ALI, PLI and RLI), each predict different types of business growth.
Customer loyalty is multidimensional; it is not a single thing. In fact, a factor analysis (like principle component analysis) of several customer loyalty survey questions revealed that there are really three different types of customer loyalty. The three types of loyalty (with specific survey questions) are:
- Retention Loyalty is the extent to which customers remain customers and/or do not use a competitor and leads to long-term customers who are easier to service.
- How likely are you to switch to another provider?
- How likely are you to renew your service contract?
- Advocacy Loyalty is the extent to which customers advocate your product and/or brand and leads to the acquisition of new customers.
- How likely are you to recommend us to your friends/colleagues?
- Overall, how satisfied are you with our performance?
- Purchasing Loyalty is the extent to which customers increase their purchasing behavior and leads to increases in the average revenue per customer.
- How likely are you to purchase different solutions from us in the future?
- How likely are you to expand the use of our products throughout your company?
These three types of customer loyalty questions were predictive of different types of business growth (see Figure 2). In a nationwide study asking over 1000 customers about their current network operator, different loyalty questions were predictive of different types of objective business growth metrics:
- Retention loyalty questions were the best predictor of future churn rate
- Advocacy loyalty questions (including the recommend question) were a good predictor of new customer growth
- Purchasing loyalty questions were the best predictor of Average Revenue per User (ARPU) growth
By using only the NPS question, you are limiting your understanding of the health of your customers. Selecting the right customer loyalty questions for your survey requires careful thought about your customers and your business. Think about how your customers are able to show their loyalty toward your company and include loyalty questions that reflect those loyalty behaviors you want to manage and change.
Additionally, consider your business growth strategy and current business challenges and select loyalty questions that will help you address those challenges. For example, if you have a high churn rate, you might consider using a retention loyalty question to more effectively identify solutions to increase customer retention. Additionally, if you are interested in increasing ARPU (average revenue per customer), you might consider including a purchasing loyalty question.
Bottom Line: The NPS an insufficient loyalty measure. Customers can engage in a variety of loyalty behaviors. Think about customer loyalty more broadly and include different types of loyalty questions that meet your specific business needs.
Summary
Research using data science principles shows that the NPS has three major problems. First, the claim that the NPS is the best predictor of growth is flat out wrong. The preponderance of the evidence shows that “overall satisfaction” and “buy again” questions are comparable to the “recommend” question in predicting new customer growth.
Second, the NPS is calculated using a difference score that, more likely, confuses people than enlightens them. Mean scores keep the metric on the same scale of measurement (0 to 10) and makes the results easier to interpret.
Third, the NPS measures only one of the three types of customer loyalty. Using a comprehensive set of loyalty questions will help you target solutions to optimize different types of customer loyalty of existing customers and, consequently, improve business growth. Including a “likelihood to quit” question and a “likelihood to buy different” question can help you understand why customer are leaving and identify ways to increase customers’ purchasing behavior, respectively.
If the NPS has these problems, why is it being used in its current form? Remember that, in the 15th century, everyone believed that the sun revolved around the earth. It made sense, after all. From people’s perspective, it appeared that the earth was the center of the universe. With heavy mathematical gymnastics, you could even explain the retrograde motion of the planets. However, based on observational evidence via a telescope, Galileo Galilei realized that, in fact, the earth revolves around the sun. The evidence-based picture of the world eventually won out. So, stop listening to dogma and follow the evidence.
An earlier version of this article was published on CustomerThink.


 Beyond the Ultimate Question
 Measuring Customer Satisfaction and Loyalty (3rd Ed.)
This is an interesting analysis, although there might be a bit of a straw man involved. Wouldn’t most companies concede that more than one measure is a good idea, ie, ASCI and NPS, rather than just one? NPS has the advantages that a small business can easily and cheaply apply it and understand it, and that one question lends itself to focus, a perennial problem in branding. There’s also an internal marketing aspect to using NPS that is missed here. NPS signals to company’s work force that satisfying customers isn’t the goal–delighting them is. It would be interesting to know the time span of the correlations in the study in #3. Businesses might justifiably believe that over the longer term, retention will not be served by merely satisfying. The belief that new competitors will always be emerging to top the service they provide if they don’t have sufficient numbers of evangelists is one factor that makes NPS conceptually convincing. And I don’t see evidence here that it doesn’t work as a rough correlate of growth. Considering the cost-effectiveness and communication advantages to be gained from a single question, I’d hesitate to throw out NPS as “dogma” just because it doesn’t employ a lot of statisticians and doesn’t yield every single piece of information available.