Customer surveys remain the primary source of customer feedback for many companies, despite the growth in adoption of other customer feedback sources like social media, call center conversations and emails. Customer surveys typically contain structured questions, asking customers to rate their level of satisfaction with their experience. Two popular customer surveys are relationship and transactional surveys. The primary difference between the two surveys is that relationship surveys measure attitudes about the experience (looking back over a long period) and transactional surveys measure attitudes in the experience (in the moment). These survey approaches are used to help businesses improve strategic and tactical decision-making, respectively.
Big Data
Customer surveys can provide rich information about customers. They provide the data that fuel the customer experience analytics that generate the customer insights to drive the business forward. In this new Big Data world, however, it’s clear that businesses are now able to use different sources of data (e.g., buying behavior, number of calls) as well as the accompanying technology (e.g., quick processing, text analytics) to get additional customer insights. Here are four things companies can do to improve their customer surveys.
1. Have Clear Analytic Goals

Businesses, having access to so much data, can easily get lost in a cycle of never-ending analysis. Be sure to be clear about your analytic goals. Click image to read about the what and where of Big Data.
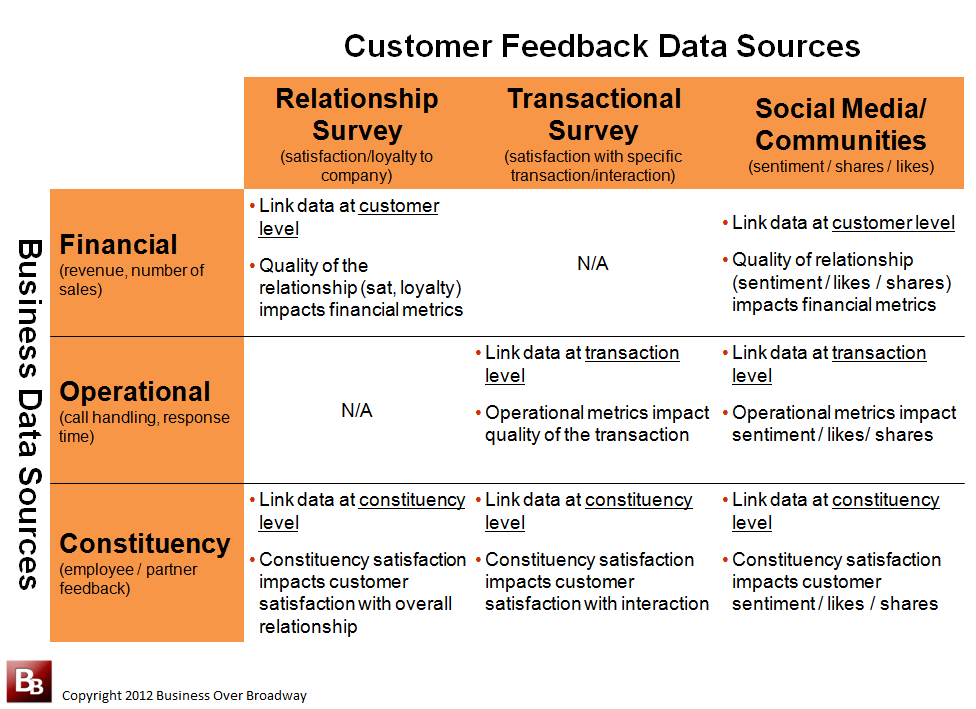
Companies are merging different data sources together to get better insight about their customers. Companies are analyzing data from CRM systems, public data (e.g., weather), inventory data to make better predictions about their customers, resulting in an explosion of possible analyses they can run on the combined data set. With hundreds of variables to consider, it’s easy to get stuck in a never-ending circle of analysis, not taking action on any given result (aka analysis paralysis).
Be sure to set clear goals for your analysis. Approach your data with a specific problem you are trying to solve and tailor analytics to solve that problem. Generally speaking, analytics is a way of helping you identify how to optimize an outcome, any outcome. Pick your key outcome (e.g., loyalty, sentiment, see point 4 below) and identify the situations where that outcome is optimized. For example, in call centers, looking at relationships between operational metrics (what happens to the customers) and customer satisfaction ratings (what customers feel) can provide new insights about how to improve the operations to increase customer satisfaction.
2. Personalize Reporting
With more data comes more analytics and metrics. Big Data technology can quickly sift through different metrics and present them in a variety of ways. Because not everybody needs the same reports with the same metrics, make sure your analysis and reporting are tailored to your audiences’ needs. Executives, mid-managers and front-line staff require different types of information to assist them in role-specific decision-making. Executives need high-level reports about their organization to help them make better strategic decisions (e.g., allocating resources to the right areas to improve customer loyalty). Managers will need to a look at the CX results to help them make better tactical decisions (e.g., knowing what to do to improve the customer experience). Still further, front-line staff in call centers may need more detailed, real-time results to manage callers. Different organizational roles require different types of information to assist in different types of decision-making. The process of quickly pulling, integrating and presenting the right summary helps each group make better decisions.
3. Leverage Text Analytics
Text analytics can be used to tell you what customers are talking about and how they feel (e.g., customer sentiment) about it. Click image to read about the Customer Sentiment Index for customer surveys.
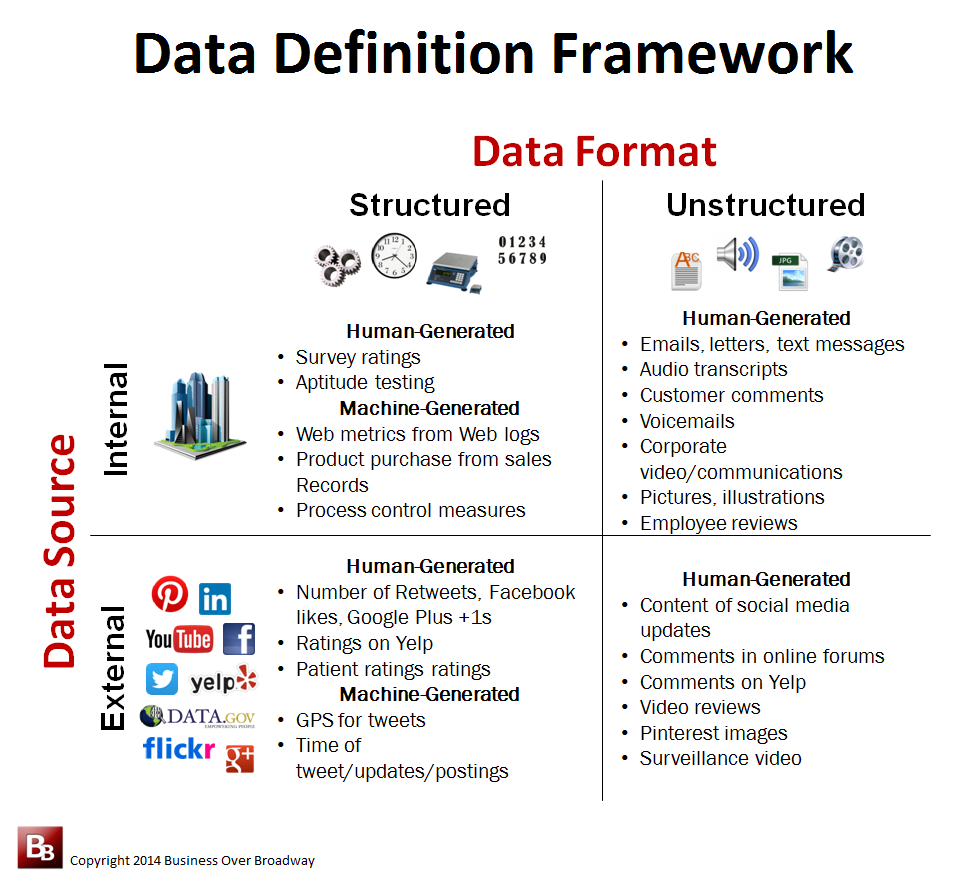
Data can come in two formats, structured and unstructured. Because much of the data generated today is unstructured, companies have developed ways of extracting value from what customers say about them. Text analytics can be applied to customer surveys to help you get insights about a couple of things.
First, text analytics can categorize comments into general themes, helping you identify common customer pain points. Knowing what customers are saying about you is a good first step toward understanding how to improve their experience.
Second, text analytics provide an effective way of extracting customers’ sentiment or attitudes. The use of sentiment analysis has been driven primarily by attempts to extract attitudes from social media sources like Twitter and Facebook. However, businesses can apply sentiment analysis principles in customer surveys to measure customer sentiment, helping them to identify at risk customers.
4. Use Real Loyalty Behaviors in your Analysis

Customer loyalty is about what customers actually do. Include objective measures of customer loyalty in your CX analytics.
Customer relationship surveys typically include questions asking customers to indicate their loyalty intentions (e.g., likelihood to… recommend, buy, buy more). In the world of Big Data, companies have a history of customer loyalty behaviors in their CRM systems, making self-reported loyalty questions obsolete. In your analytic efforts, use objective loyalty metrics as the criteria along with CX satisfaction questions as the predictors. We are more interested in predicting real loyalty behaviors than behavioral intentions. If we already have access to the metric of interest (behavior), why ask a question about it (intentions)?
Also, using objective loyalty metrics in your analysis reduces the problem of common method variance that can artificially inflate the correlation between satisfaction and loyalty. The correlation between CX satisfaction and loyalty is used to denote the importance of satisfaction on improving customer loyalty. The size of the correlation is due, in part, to the fact that the same method is being used to measure both satisfaction and loyalty (i.e., self-reports using a similar rating scale). Because of the problem of common method variance, I think that we have been over-inflating the importance of the customer experience, perhaps contributing to an unrealistic expectation on the part of executives of what CX improvements will do. Maybe the executives’ lack of action stems from their lack of belief of what ROI analyses of CX improvements typically show.
Summary
Customer experience programs need to adapt in this world of Big Data. I took a look at customer surveys to outline some ways companies can optimize this process. Companies need to incorporate four things in their customer survey process: identify business goals of analytics, personalize reports, leverage text analytics and use objective loyalty behaviors in their analysis. Adopting these practices will help improve the value companies can get from their customer surveys.
This article was originally published on CustomerThink.


 Beyond the Ultimate Question
 Measuring Customer Satisfaction and Loyalty (3rd Ed.)
[…] Customer surveys remain the primary source of customer feedback for many companies, despite the growth in adoption of other customer feedback sources like social media, call center conversations and emails. […]