Last month, I illustrated a new method of measuring customers’ attitudes about a company’s product or brand. This method is unique because it combines both a structured and unstructured measurement approach. Companies can use an open-ended survey question that asks customers to provide a single word that best describes the company/brand. From this one word, companies can apply a numerical value to each word that represents a sentiment value for that word. I found that customer sentiment (as measured by this new method) is highly correlated with traditional ratings of customer satisfaction (r = .71). In today’s post, I will explore the extent to which this new method of measurement is predictive of different types of customer loyalty, including likelihood to recommend, likelihood to purchase more and likelihood to churn.
Sample
The sample of respondents were solicited from Amazon Turk to complete a customer survey about their current wireless service provider. I received 460 completed survey response. The customer survey contained several questions that included the new method (i.e., “What one word best describes your wireless service provider?”) as well as questions from a standard customer relationship survey (see Customer Relationship Diagnostic).
Metrics
The survey included several customer loyalty questions that will be highlighted in the analysis:
- How likely are you to recommend <company name> to your friends/colleagues?
- How likely are you to purchase additional services from <company name in the next 12 months?
- How likely are you to switch to a different wireless service provider within the next 12 months?
For each of the loyalty questions above, respondents were asked to indicate how likely they are to engage in the specific behavior in question using the following scale: 0 (Not at all likely) to 10 (Extremely likely).
Customer sentiment was calculated by applying a sentiment score to each word. The sentiment scores for particular words were derived using existing data from several large annotated corpora. This mapping of sentiment values to words constitutes the Customer Sentiment Index. The CSI can range from 0 (negative sentiment) to 10 (positive sentiment).
Results
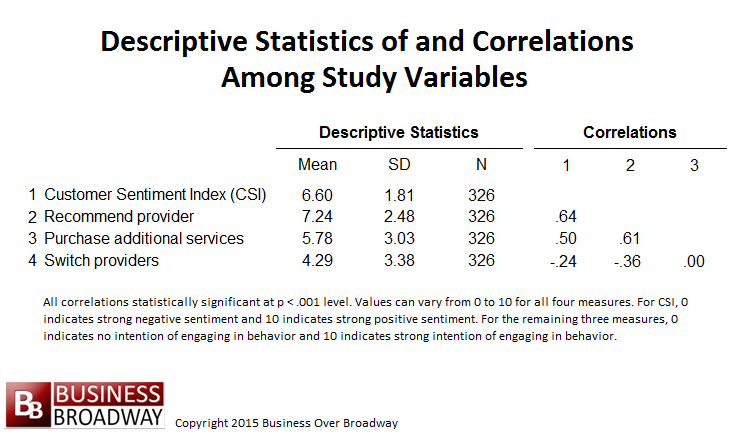
The descriptive statistics of and the correlations among the four measured are presented in Table 1. As a whole, customers are more likely to recommend their wireless service providers (7.24) than they are to purchase additional services from them (5.78). Also, as a whole, customers are not likely to switch providers (4.29).
Looking at the relationship of CSI scores with each measure of customer loyalty, we find that CSI was more strongly related to recommending intentions compared (r = .64) to purchasing intentions (r = .50) and switching intentions (r = -.24). It appears that sentiment primarily drives advocacy behaviors (e.g., recommending), and, to a lesser degree, purchasing and retention behaviors.
Mapping the Relationships
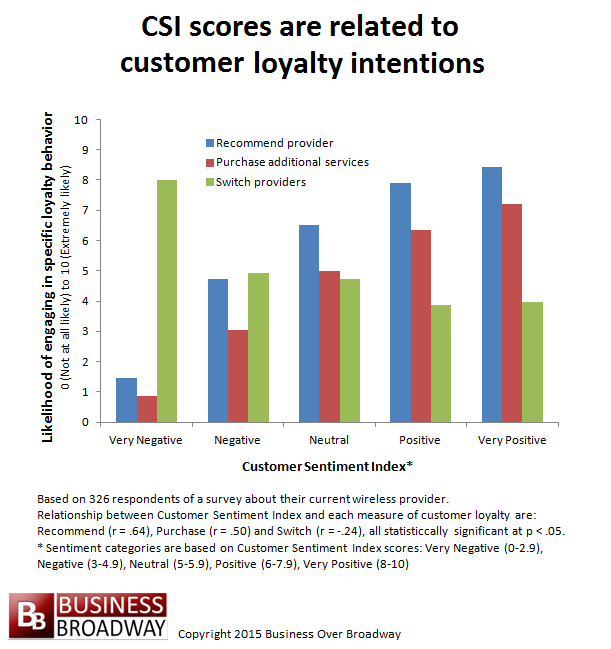
Next, I plotted (see Figure 1) the relationships among the study variables to better understand how customer sentiment is related to the different types of customer loyalty. As you can see in Figure 1, customer sentiment is linearly related to both recommending and purchase intentions. However, customer sentiment is not linearly related to switching intentions; that is, increasing levels of positive sentiment have little effect on decreasing switching intentions. So, while increasing levels of sentiment indicate in higher levels of recommendations and purchases from your customers, it would not necessarily mean lower levels of customer churn.
Summary
A single word response in a customer survey can be used to both quantify customer sentiment toward a brand (via Customer Sentiment Index) and provide a useful metric about the health of the customer relationship.
The Customer Sentiment Index (CSI) appears to be a useful predictor of customer loyalty. Customer sentiment is closely associated with recommendation and purchasing intentions and weakly associated with switching intentions. Lower levels of customer sentiment are associated with poorer levels of customer loyalty.
Recommending and purchasing behaviors are strongly driven by the overall quality of the customer relationship (as measured by the CSI). On the other hand, switching behaviors appear to be less relationship-driven; negative types of loyalty behaviors could driven more by specific events or transactions (e.g., promotional offer to switch, infuriating customer experience) than the quality of the overall relationship.
This article originally appeared on CustomerThink.


 Beyond the Ultimate Question
 Measuring Customer Satisfaction and Loyalty (3rd Ed.)
Comments are closed.