


 Customer experience management professionals use self-reported “likelihood” questions to measure customer loyalty. In their basic form, customer loyalty questions ask customers to rate their likelihood of engaging in different types of loyalty behaviors toward the company, including behaviors around retention (likelihood to leave), advocacy (likelihood to recommend) and purchasing (likelihood to buy different products). These loyalty questions typically employ a “0 to 10” rating scale that includes verbal anchors at each end of the scale to indicate low or high likelihood (e.g., 0 = not at all likely to 10 = extremely likely; 0 = least likely to 10 = most likely).
While it is generally accepted that higher likelihood ratings represent higher levels of loyalty, we are left with some ambiguity about what defines “good” likelihood ratings. How much better is a score of 8 than 7? Is there a meaningful difference between a rating of 7 and 6? I explored the meaning of likelihood ratings in the present analysis.
The Data
Data are from a customer survey of a large automobile dealership located on the east coast. The current analysis is based on 30,236 respondents over a 4-year period (2010 thru Nov 2013) across 20 different locations. The survey asked customers six questions, including two similar loyalty questions:
- How likely is it that you would recommend your sales person to a friend or colleague? Rating options were on a rating scale from 0 (Least Likely) to 10 (Most Likely).
- Would you recommend your sales associate to a friend, relative or neighbor? Response options were either “Yes” or “No.”
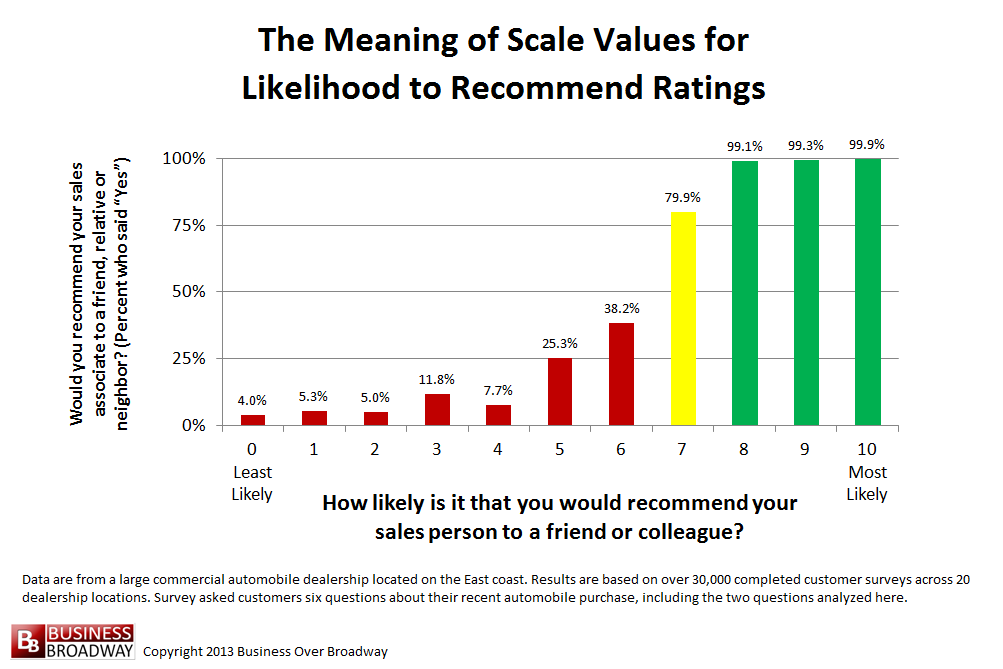
Figure 1. Meaning of Scale Values for Likelihood to Recommend Ratings
Results
Figure 1 illustrates the relationship between these two different loyalty questions, showing the percent of “Yes” responses of second loyalty question across each of the 11 response options of the first loyalty question. Generally, the percent of customers who say they would recommend the company drops as the likelihood to recommend ratings drop. We see a few interesting things when we look a little closer at this figure:
- There is no major difference between ratings of 8, 9 and 10 with respect to the percent of customers who say they would recommend. For each of the top likelihood scale values, nearly all (over 99%) customers say they would recommend.
- Likelihood ratings of 0 through 6 represent negative loyalty responses; for each of these likelihood values, most customers would not recommend.
- There is a substantial increase in loyalty from a likelihood rating of 6 (38% say “Yes”) to 7 (80% say “Yes”) .
Implications
There are few implications regarding the results of the current analysis. First, companies use customer segmentation analysis to create homogeneous groups of customers to target each group with specific marketing, sales and service initiatives to improve or maintain overall customer loyalty. The developers of the Net Promoter Score segment customers into three groups based on their likelihood rating: Promoters (ratings of 9 or 10), Passives (ratings of 7 or 8) and Detractors (ratings of 0 through 6). The results of the present analysis, however, suggest a slightly different segmentation. The results show that customers who give a likelihood rating of 8 are more similar to customers who give a rating of 9 or 10 (Promoters) than they are to customers who give a rating of 7 (Passives).
Second, the segmentation of customers based on the NPS trichotomy seems arbitrary. The current results supports a slightly different segmentation of customers into different, more homogeneous groups. These three new customer segments are:
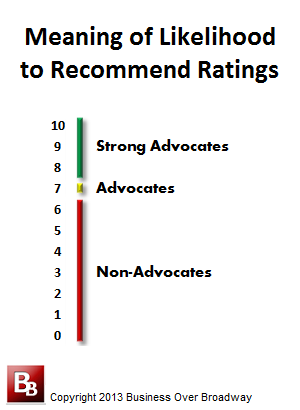
- Strong Advocates: Customers who give a likelihood rating of 8, 9 or 10. Over 99% percent of Strong Advocates say they would recommend.
- Advocates: Customers who give a likelihood rating of 7. About 80% of Advocates say they would recommend.
- Non-Advocates: Customers who give a likelihood rating of 0 through 6. On average, 84% of Non-Advocates say they would not recommend. These customers are labeled Detractors in NPS lingo. The relabeling of this group of customers as “Non-advocates” more honestly reflects what is being measured by the “likelihood to recommend” question. See Word-of-Mouth Index that more fully explores this notion.
Finally, it appears that all Detractors are not created equal. While ratings of 0 through 6 do represent low loyalty, a likelihood rating of 6 is a little more positive than the lower likelihood ratings. Targeting improvement initiatives that blanket all are typically directed at customers who report low levels of loyalty, those giving a likelihood rating of 6 or less. However, it might be beneficial to further segment these at-risk customers to target improvement initiatives to customers giving a rating of 6. Recall that a likelihood rating of 7 results in a substantial increase in recommending. Moving customers from a likelihood rating from 0 to 1 or 1 to 2 does very little to increase recommendations. Moving customers from a likelihood rating from 6 to 7, however, results in a substantial increase in recommending.
 Beyond the Ultimate Question
 Measuring Customer Satisfaction and Loyalty (3rd Ed.)
Interesting research Bob and a good topic for debate. But I do have two major issues with your methodology and conclusions:
– There is obviously a difference between stated intention to recommend and actual recommend behaviour: stated is always higher than actual. The original research on Net Promoter was based upon observed behaviour when it comes to offering recommendations. Indeed, the research uncovered patterns which provide guidelines around the number of positive or negative referrals a promoter (9-10 rating) or detractor (0-6 rating) actually will actually make. The original segmentation of responses was in part based upon this divide.
– Secondly, if we assume that your stated intention to recommend is a good proxy for actual behaviour, I still don’t believe this captures the whole picture. The original 0-6 / 9-10 segments were defined not only by the word-of-mouth component, but also on loyalty behaviours (re-purchase, wallet-share, cost to serve, etc). A segmentation must include these other loyalty behaviour (for example, the churn rate of an ‘extreme detractor’ rating 0-3 is higher than for someone answering 5-6).
That all said, I’m not one to suggest there always has to be a hard-and-fast rule for all companies. I encourage my clients to try and find the right linkage and validation for their Net Promoter rankings to make the best decisions possible.
Paul,
Thanks for your comments. Regarding your first point, I agree that self-reported behaviors are typically higher than actual behavior. If I had observed recommending behaviors, that would have made for a better analysis, for sure. But studies are never perfect. You stated that the NPS segments were based on actual behavior. Could you please provide some links to research on that topic? I would love to see the results.
Regarding your second point, other loyalty behaviors (e.g., churn, share of wallet) need to be considered in this thing we call “customer loyalty,” but equating these other loyalty behaviors with recommending intentions muddies our creation of customer segments as well as the quality of what we are measuring. If you’re interested in churn, a better approach would be ask directly about intentions to leave. If you’re interested in share-of-wallet, ask about intentions of buying more/additional.
Further, customer loyalty is multidimensional. Asking about different types of customer loyalty provides better predictive power of different types of business growth. Advocacy is a better predictor of new customer growth. Purchasing intentions is a better predict or ARPU (average revenue per user) growth. Retention intentions is a better predictor of actual churn. I’ve rounded up some articles that talk about this customer loyalty trichotomy (http://bit.ly/1e3M01V).
Hello Bob: You have raised a very fundamental issue related to discriminating power of human being while using likert type scales. i have read in some paper ( written by psychologists) that it is better to use a 7 point scale. I do not remember where I have read it. The point mentioned was, people can not discriminate with finer scales with more than 7 points.
Big thanks to you for sharing the analysis in public domain.
Prabir