Patient experience (PX) has become an important topic for US hospitals. The Centers for Medicare & Medicaid Services (CMS) will be using patient feedback about their care as part of their reimbursement plan for acute care hospitals (see Hospital Value-Based Purchasing Program). Not surprisingly, hospitals are focusing on improving the patient experience to ensure they receive the maximum of their incentive payments. Additionally, US hospitals track other types of metrics (e.g., process of care and mortality rates) as measures of quality of care.
Given that hospitals have a variety of metrics at their disposal, it would be interesting to understand how these different metrics are related with each other. Do hospitals that receive higher PX ratings (e.g., more satisfied patients) also have better scores on other metrics (lower mortality rates, better process of care measures) than hospitals with lower PX ratings? In this week’s post, I will use the following hospital quality metrics:
- Patient Experience
- Health Outcomes (mortality rates, re-admission rates)
- Process of Care
I will briefly cover each of these metrics below.

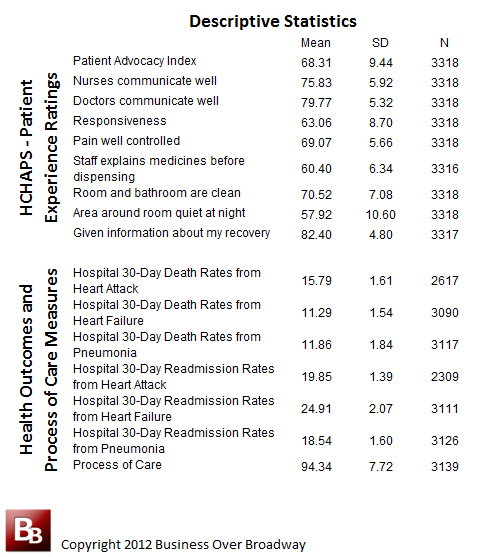
Table 1. Descriptive Statistics for PX, Health Outcomes and Process of Care Metrics for US Hospitals (acute care hospitals only)
1. Patient Experience
Patient experience (PX) reflects the patients’ perceptions about their recent inpatient experience. PX is collected by a survey known as HCAHPS (Hospital Consumer Assessment of Healthcare Providers and Systems). HCAHPS (pronounced “H-caps“) is a national, standardized survey of hospital patients and was developed by a partnership of public and private organizations and was created to publicly report the patient’s perspective of hospital care.
The survey asks a random sample of recently discharged patients about important aspects of their hospital experience. The data set includes patient survey results for over 3800 US hospitals on ten measures of patients’ perspectives of care (e.g., nurse communication, pain well controlled). I combined two general questions (Overall hospital rating and recommend) to create a patient advocacy metric. Thus, a total of 9 PX metrics were used. Across all 9 metrics, hospital scores can range from 0 (bad) to 100 (good). You can see the PX measures for different US hospital here.
2. Process of Care
Process of care measures show, in percentage form or as a rate, how often a health care provider gives recommended care; that is, the treatment known to give the best results for most patients with a particular condition. The process of care metric is based on medical information from patient records that reflects the rate or percentage across 12 procedures related to surgical care. Some of these procedures are related to antibiotics being given/stopped at the right times and treatments to prevent blood clots. These percentages were translated into scores that ranged from 0 (worse) to 100 (best). Higher scores indicate that the hospital has a higher rate of following best practices in surgical care. Details of how these metrics were calculated appear below the map.
I calculated an overall Process of Care Metric by averaging each of the 12 process of care scores. The process of care metric was used because it has good measurement properties (internal consistency was .75) and, thus reflects a good overall measure of process of care. You can see the process of care measures for different US hospital here.
3. Health Outcomes
Measures that tell what happened after patients with certain conditions received hospital care are called “Outcome Measures.” We use two general types of outcome measures: 1) 30-day Mortality Rate and 2) 30-day Readmission Rate. The 30-day risk-standardized mortality and 30-day risk-standardized readmission measures for heart attack, heart failure, and pneumonia are produced from Medicare claims and enrollment data using sophisticated statistical modeling techniques that adjust for patient-level risk factors and account for the clustering of patients within hospitals.
The death rates focus on whether patients died within 30 days of their hospitalization. The readmission rates focus on whether patients were hospitalized again within 30 days.
Three mortality rate and readmission rate measures were included in the healthcare dataset for each hospital. These were:
- 30-Day Mortality Rate / Readmission Rate from Heart Attack
- 30-Day Mortality Rate / Readmission Rate from Heart Failure
- 30-Day Mortality Rate / Readmission Rate from Pneumonia
Mortality/Readmission rate is measured in units of 1000 patients. So, if a hospital has a heart attack mortality rate of 15, that means that for every 1000 heart attack patients, 15 of them die get readmitted. You can see the health outcome measures for different US hospital here.

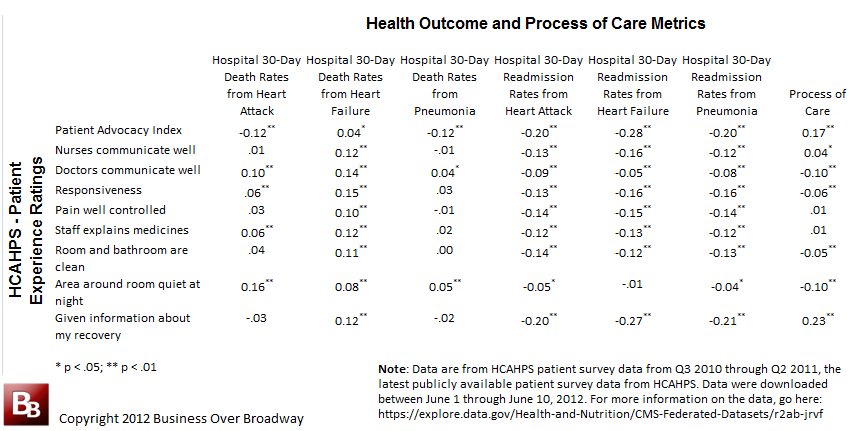
Table 2. Correlations of PX metrics with Health Outcome and Process of Care Metrics for US Hospitals (acute care hospitals only).
Results
The three types of metrics (e.g., PX, Health Outcomes, Process of Care) were housed in separate databases on the data.medicare.gov site. As explained elsewhere in my post on Big Data, I linked these three data sets together by hospital name. Basically, I federated the necessary metrics from their respective database and combined them into a single data set.
Descriptive statistics for each variable are located in Table 1. The correlations of each of the PX measures with each of the Health Outcome and Process of Care Measures is located in Table 2. As you can see, the correlations of PX with other hospital metrics is very low, suggesting that PX measures are assessing something quite different than the Health Outcome Measures and Process of Care Measures.
Patient Loyalty and Health Outcomes and Process of Care
Patient loyalty/advocacy (as measured by the Patient Advocacy Index) is logically correlated with the other measures (except for Death Rate from Heart Failure). Hospitals that have higher patient loyalty ratings have lower death rates, readmission rates and higher levels of process of care. The degree of relationship, however, is quite small (the percent of variance explained by patient advocacy is only 3%).
Patient Experience and Health Outcomes and Process of Care
Patient experience (PX) shows a complex relationship with health outcome and process of care measures. It appears that hospitals that have higher PX ratings also report higher death rates. However, as expected, hospitals that have higher PX ratings report lower readmission rates. Although statistically significant, all of the correlations of PX metrics with other hospitals metrics are low.
The PX dimension that had the highest correlation with readmission rates and process of care measures was “Given Information about my Recovery upon discharge“. Hospitals who received high scores on this dimensions also experienced lower readmission rates and higher process of care scores.
Summary
Hospitals are tracking different types of quality metrics, metrics being used to evaluate each hospital’s performance. Three different metrics for US hospitals were examined to understand how well they are related to each other (there are many other metrics on which hospitals can be compared). Results show that the patient experience and patient loyalty are only weakly related to other hospital metrics, suggesting that improving the patient experience will have little impact on other hospital measures (health outcomes, process of care).


 Beyond the Ultimate Question
 Measuring Customer Satisfaction and Loyalty (3rd Ed.)
[…] Evaluating Hospital Quality using Patient Experience, Health Outcomes and Process of Care Measures […]
[…] Patient experience (PX) has become an important topic for US hospitals. The Centers for Medicare & Medicaid Services (CMS) will be using […]
[…] Evaluating Hospital Quality using Patient Experience, Health Outcomes and Process of Care Measures […]
[…] process of care measures was “Given Information about my Recovery upon discharge“. Hospitals who received good patient ratings on this dimension also experienced lower readmission rat… compared to hospitals with poor patient ratings in this […]
[…] rates and process of care measures was “Given Information about my Recovery upon discharge“. Hospitals who received good patient ratings on this dimension also experienced lower readmission rat… compared to hospitals with poor patient ratings in this […]